最近看一本人工智能的书,用到了matplotlib.pylab这个库用来分析算法实现的偏差,Python因为爬虫,接触过,但是具体到这个库,没有使用过,好像很方便的样子,研究了一下实现方法。
考虑到以后帮小朋友,长大一点,可以用这个辅导他代数,所以稍微学习了一下,作为成果物,这里备注一下。
首先是安装环境,基本很简单顺利。(Ubuntu环境+VSC)
需要的各种依赖
numpy //数学算法 https://pypi.org/project/numpy/
scipy //科学算法 https://www.scipy.org/install.html
matplotlib //绘图 https://matplotlib.org/index.html
python-tk //界面包 或者是第三方的Wxpython库
sudo apt-get update
sudo apt-get install python-pip
pip install numpy
pip install --upgrade pip
pip install --user numpy scipy matplotlib
当然不用pip用apt应该也是可以的
sudo apt-get install python-numpy python-scipy python-matplotlib
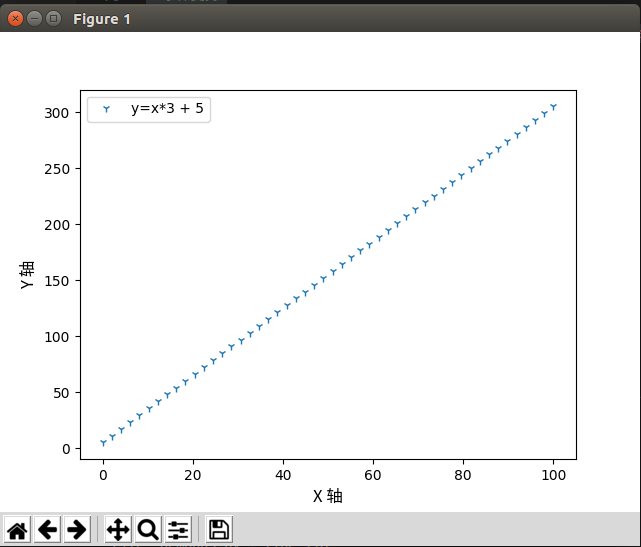
sudo apt-get install python-tk比如要生成一个 y1 = x1*3 + 5 的直线图
import scipy as sp
import matplotlib.pylab as plt
# 字体支持
from matplotlib.font_manager import FontProperties
font_set = FontProperties(fname=r"/usr/share/fonts/opentype/noto/NotoSansCJK-Regular.ttc", size=12)
x1 = sp.linspace(0.0, 100.0)        # X1取值范围
y1 = x1*3 + 5
plt.plot(x1, y1, '1',label=u'y=x*3 + 5')
plt.legend()                        # 让图例生效
plt.xlabel(u"X 轴",fontproperties=font_set)
plt.ylabel(u"Y 轴",fontproperties=font_set)
plt.savefig("test.png")             # 保存到文件
plt.show()
执行一下